How Many Households Could Each State Power Using Only Solar Energy?
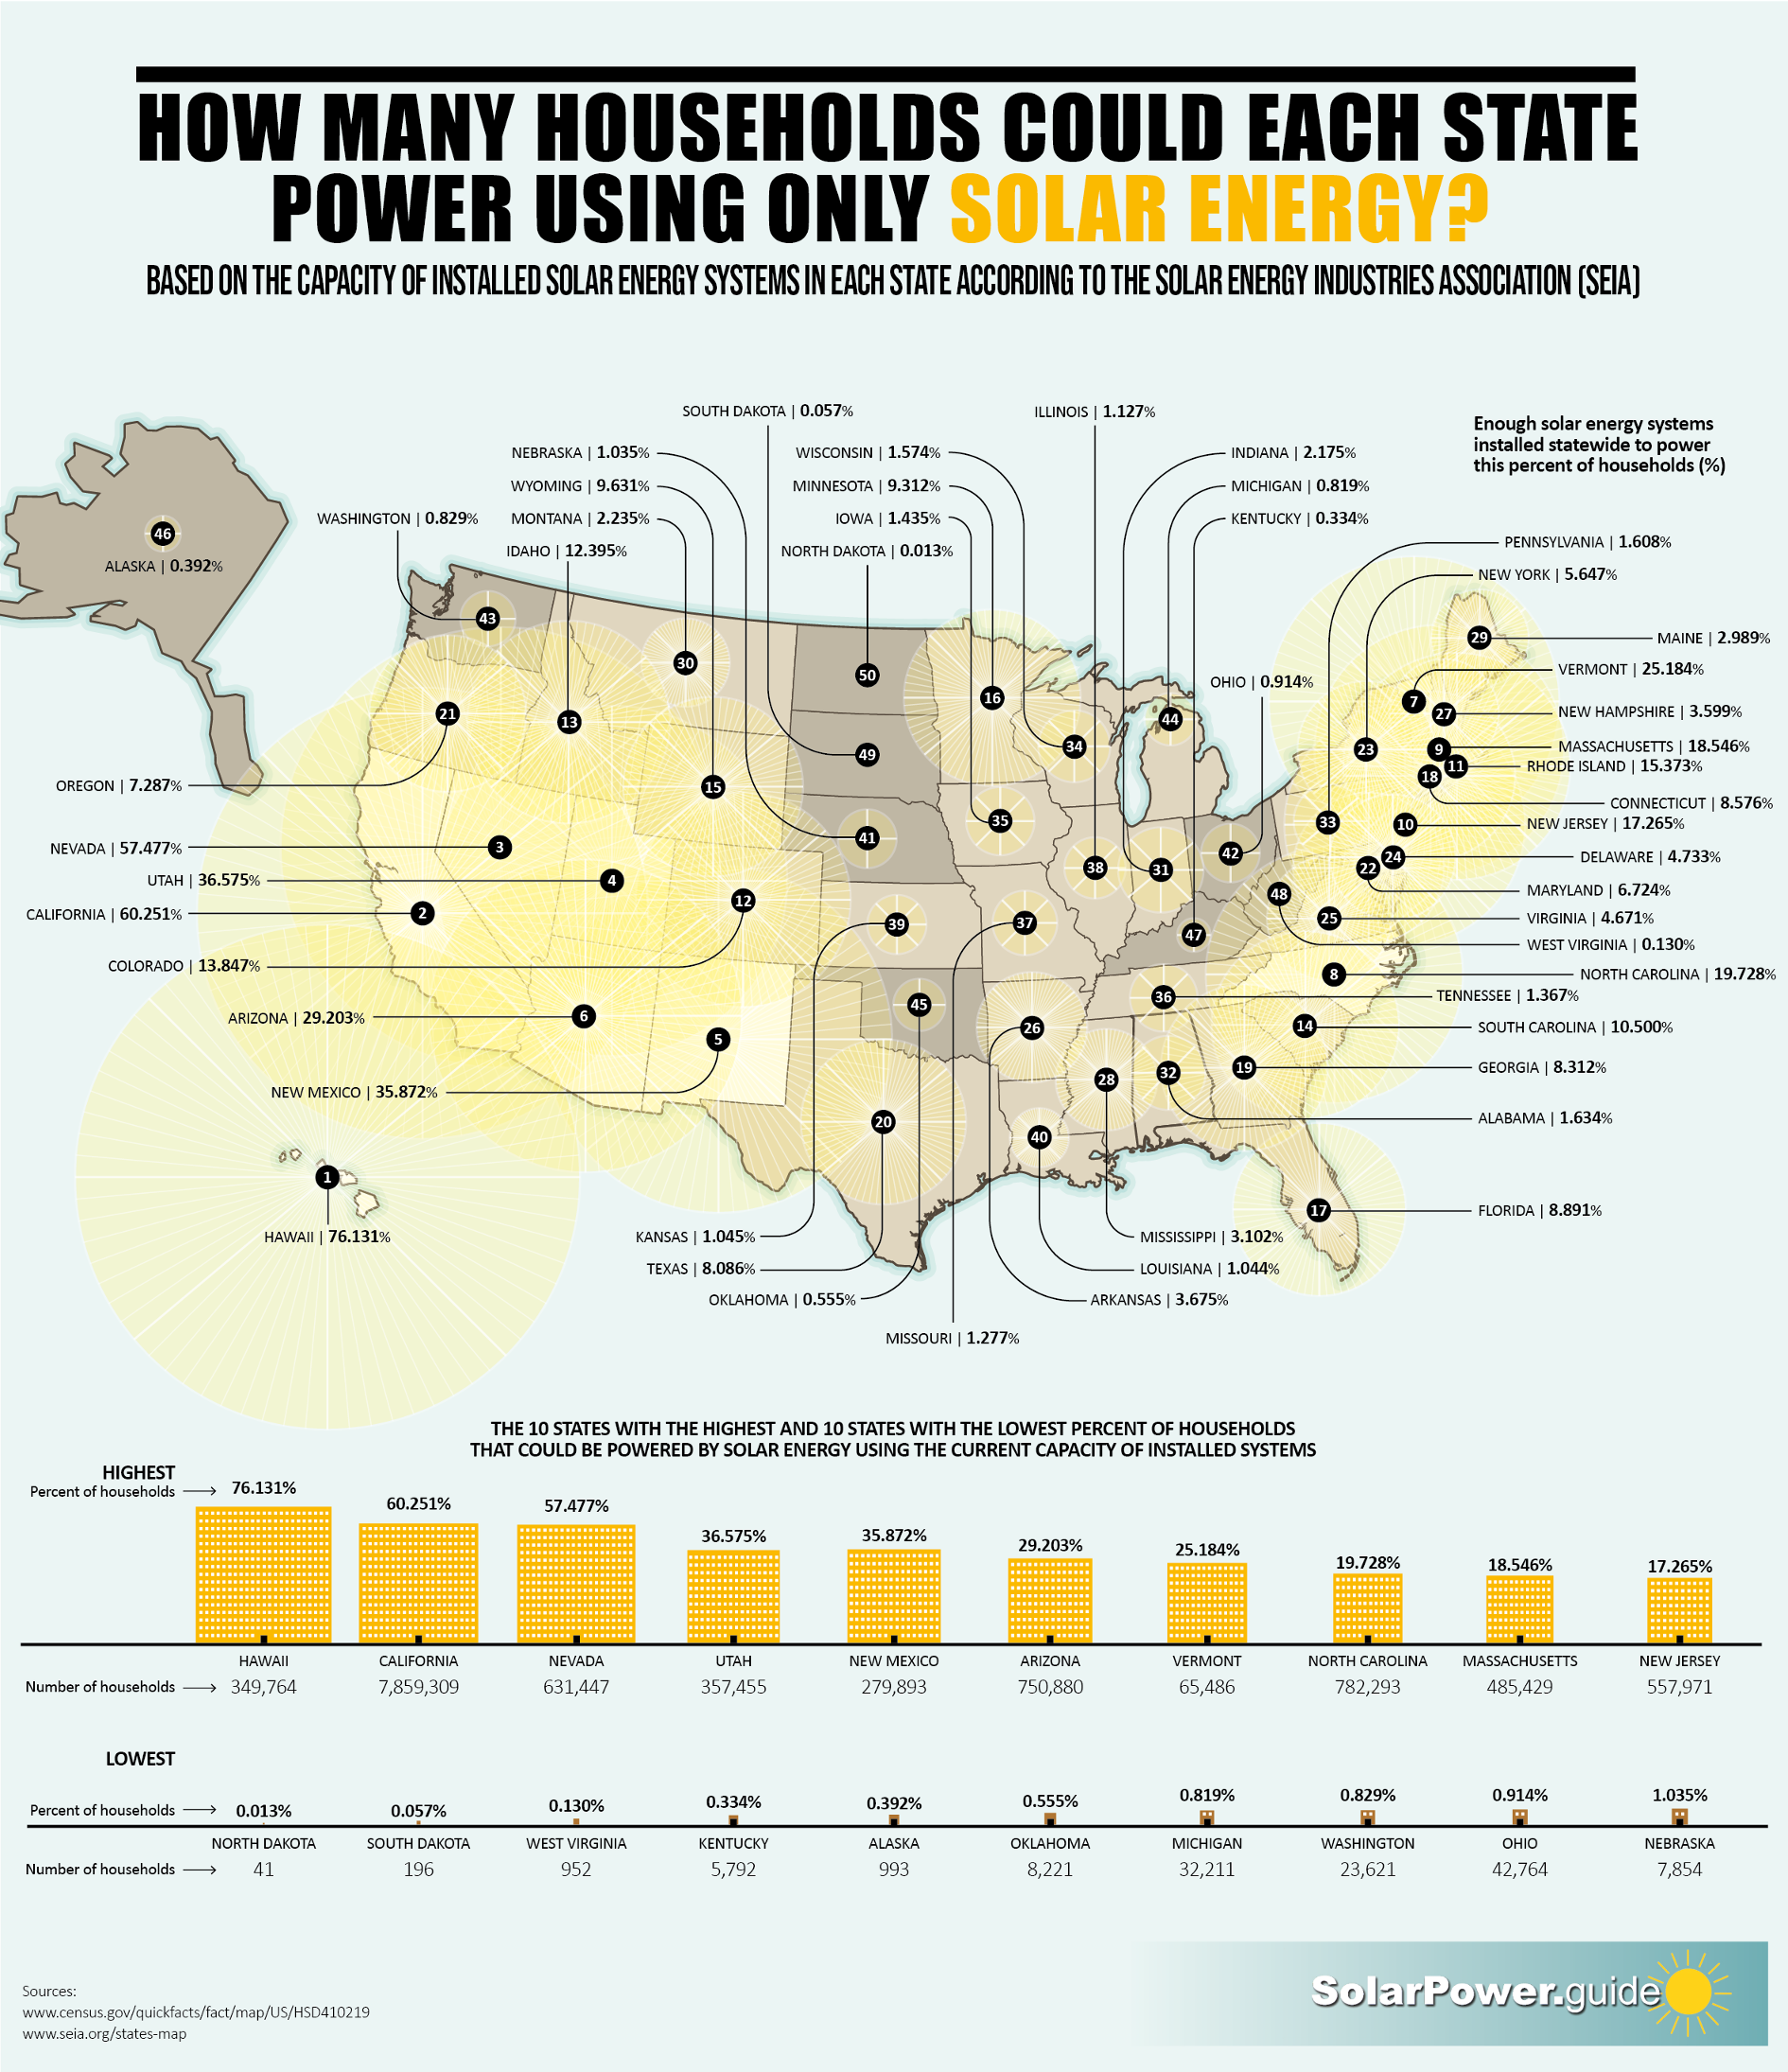
In 2020, about half of all new renewable electricity capacity added to the global electricity market was from solar energy. Dr. Fatih Birol, the International Energy Agency executive director, stated that "our projections for the next five years show that this 50% of the total new capacity may well go to about two-thirds of the new capacity additions by 2025." These statistics bode well for the future of solar energy in the United States and internationally. With the benefits of solar energy being plentiful (such as substantially reducing greenhouse gas emissions and other dangerous pollutants), solar energy can play an invaluable role in a cleaner, healthier planet. This infographic by Solar Power Guide shows that many states are already approaching impressive solar energy capacities:
Click the below image to view full-size.

Simply copy and paste the code from the box below to share.
Here are the top 25 states that could power the highest percentage of households using only their current solar energy systems:
- Hawaii – 76.1%
- California – 60.3%
- Nevada – 57.5%
- Utah – 36.6%
- New Mexico – 35.9%
- Arizona – 29.2%
- Vermont – 25.2%
- North Carolina – 19.7%
- Massachusetts – 18.5%
- New Jersey – 17.3%
- Rhode Island – 15.4%
- Colorado – 13.8%
- Idaho – 12.4%
- South Carolina – 10.5%
- Wyoming – 9.6%
- Minnesota – 9.3%
- Florida – 8.9%
- Connecticut – 8.6%
- Georgia – 8.3%
- Texas – 8.1%
- Oregon – 7.3%
- Maryland – 6.7%
- New York – 5.6%
- Delaware – 4.7%
- Virginia – 4.8%
How many solar panels does the U.S. have?
According to Energy.gov, U.S. solar panel installations have reached over 62.5 gigawatts. This is enough solar energy capacity to power the equivalent of 12 million American homes. These statistics prove that solar power is more accessible, cost-effective, and prevalent in the United States, and the popularity is increasing rapidly. Since 2008, the number of U.S. solar panel installations have increased 35-fold! Since 2014, the average cost of solar panels has dropped by around 50%. In states such as California and Hawaii, solar electricity is now economically competing with conventional sources of energy. In fact, 21% of California’s total electricity usage is covered by solar electricity. Solar energy has also proven beneficial for job growth; jobs in the solar energy field (such as solar energy technicians, solar installers, and solar power engineers) have increased nearly 160% in the past decade, which is nine times faster than the national average growth rate.
How many solar panels do I need to power my home?
The typical home would require around 28-34 solar panels to cover 100% of electricity needs, but factors such as geographic location, type of panels, and household energy consumption habits play a role. A simple way of establishing a rough estimate of necessary solar panels is to multiply your household’s hourly energy requirement by the peak sunlight hours of your area and dividing that by a panel’s wattage. A low-wattage solar panel may be 150W while a high-wattage solar panel may be 370W. This PVWatts calculator by the National Renewable Energy Laboratory can provide more targeted information for your household solar energy needs.